10 Best LaTeX Apps For Statistical Data Presentation
Imagine you’re a researcher racing against a deadline, grappling with complex statistical data that needs to be presented clearly in a journal article or thesis. LaTeX, with its unmatched precision for mathematical typesetting and professional output, can transform this challenge into an opportunity.
This article unveils the top LaTeX apps tailored for statisticians, academics, and data professionals, offering unique insights and practical tools to create publication-ready documents that stand out in 2025. From cloud-based collaboration to beginner-friendly interfaces, we’ll guide you through the best LaTeX apps for statistical data presentation, highlight their strengths, and share actionable tips to elevate your work.
1. Overleaf - Collaborative Online LaTeX Editor
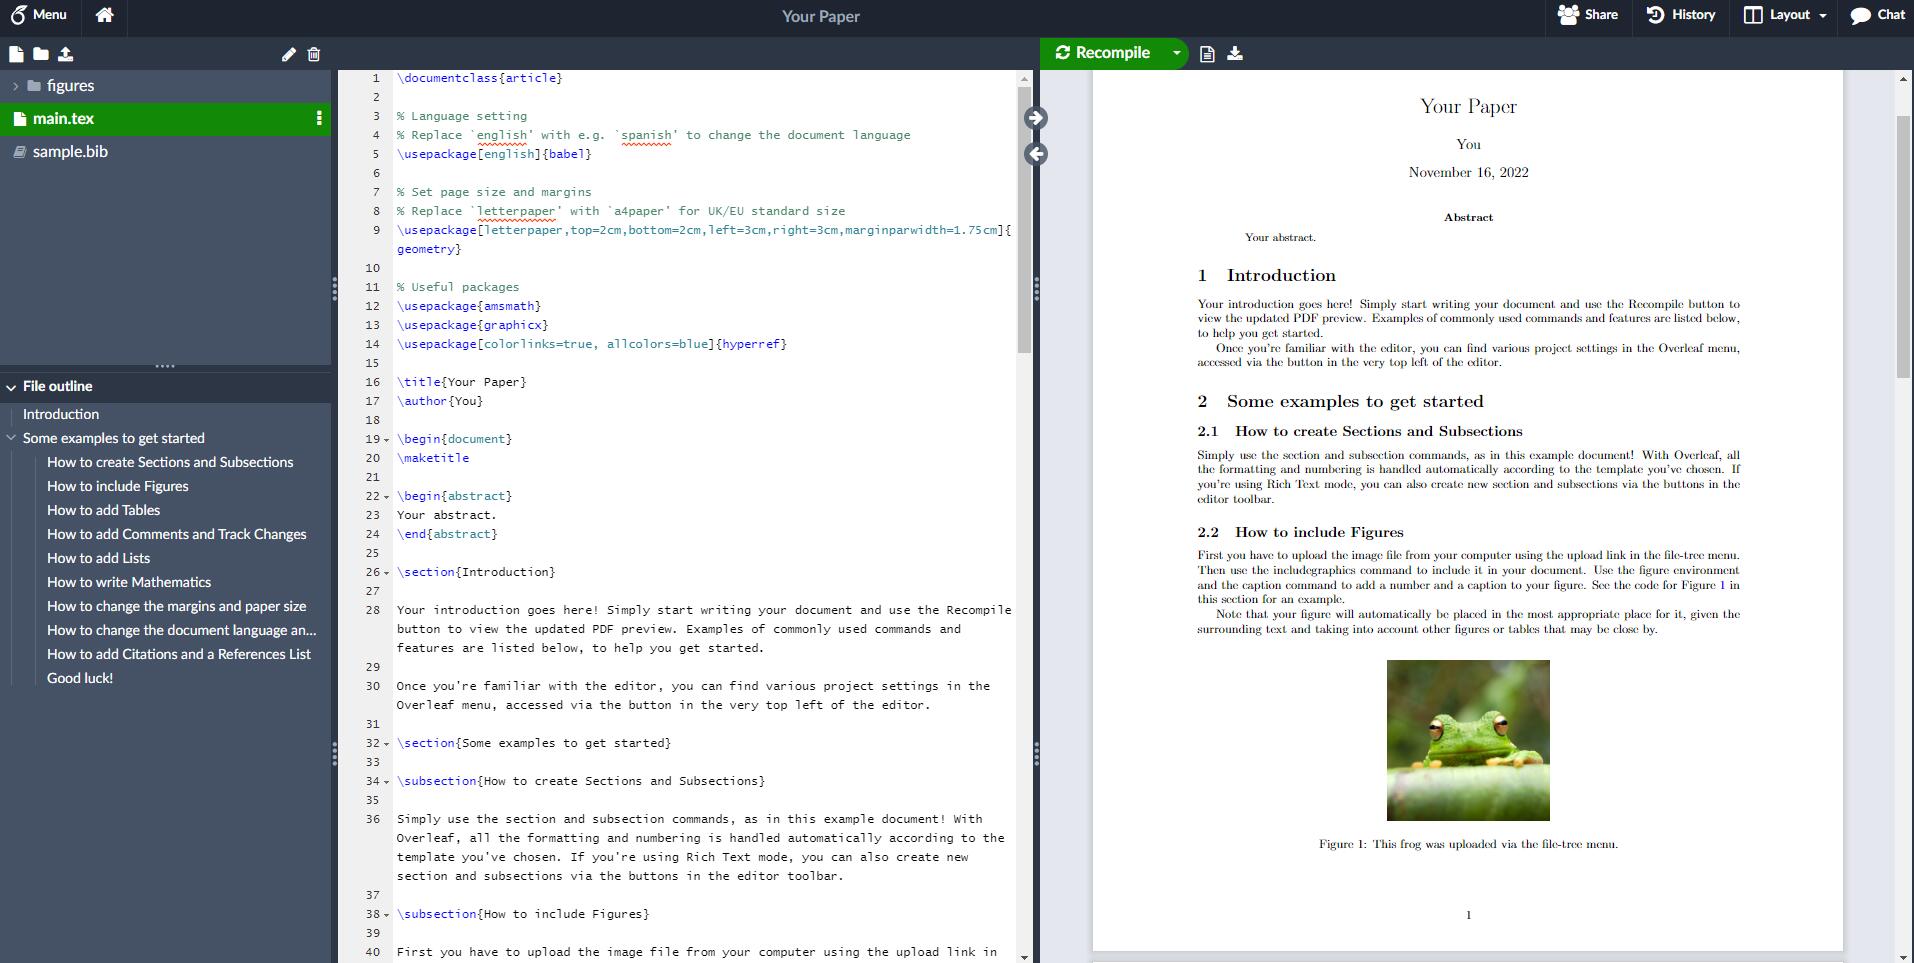
Overleaf is one of the most popular LaTeX platforms, especially for teams working on complex academic or data-driven projects. It's entirely web-based, allowing users to create, edit, and compile LaTeX documents from any browser without the need to install software. Overleaf’s main strength lies in its real-time collaboration tools, version control, and built-in PDF preview. These features are particularly valuable when multiple contributors are working on a statistical document that involves charts, code snippets, and datasets.
Overleaf also offers a rich set of templates, including those tailored for theses, reports, and scientific publications, making it easier to format tables, statistical models, and regression outputs. It supports integrations with GitHub, Dropbox, and reference management tools like Zotero, enhancing workflow efficiency. For statisticians who rely on reproducibility, Overleaf is compatible with tools like knitr or R Markdown when working with statistical software such as R, enabling automatic updating of data and graphs in LaTeX files.
2. TeXstudio - Integrated Writing Environment

TeXstudio is a free, open-source LaTeX editor offering a fully integrated writing environment. It supports features such as syntax highlighting, code folding, spell checking, and a built-in viewer with forward and inverse search. These functionalities improve productivity when working with large statistical documents full of tables, equations, and references. It also provides a wide array of macros and assistants, reducing the time spent typing or debugging complex LaTeX code.
For statistical data presentation, TeXstudio shines with its customizable build options and support for various compilers like pdfLaTeX, XeLaTeX, and LuaLaTeX. This flexibility allows users to integrate external data tools like R or MATLAB and produce high-quality statistical reports. It also handles packages such as pgfplotsand tikzefficiently, which are vital for producing graphs, plots, and advanced visualizations within LaTeX documents.
Related Reading - Mastering LaTeX - A Beginner's Guide To Beautiful Typesetting
3. LyX - WYSIWYG LaTeX Editor
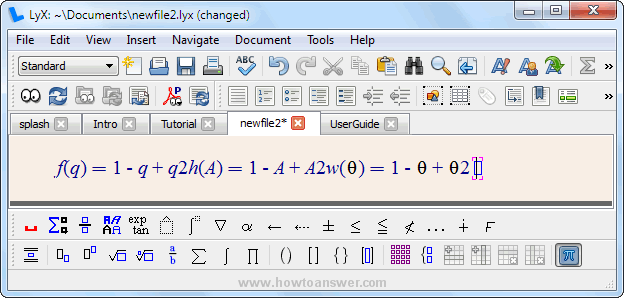
LyX offers a graphical user interface that abstracts away much of LaTeX’s code-heavy environment, making it ideal for users who prefer visual editing. While LyX still relies on LaTeX under the hood, it allows users to focus on content and structure without worrying about syntax. This makes it particularly appealing for those producing statistical papers that require numerous equations, figures, and references but who may not be experts in LaTeX code.
Its ability to manage bibliographies, indexes, and cross-references makes LyX a powerful option for complex academic writing. For statistical users, LyX supports R integration via Sweave and knitr, allowing analysts to embed R code chunks directly into documents. This capability ensures that figures and tables are dynamically generated from the latest data, ensuring accuracy and reproducibility in your statistical presentations.
4. TeXmaker - Cross-Platform LaTeX Editor
Texmaker Tutorial: How to Install and Get Started on Windows
TeXmaker is a feature-rich, cross-platform LaTeX editor that runs on Windows, macOS, and Linux. It comes with an integrated PDF viewer, spell checker, code completion, and an extensive library of LaTeX symbols. TeXmaker supports quick insertion of tables and mathematical symbols, which is essential when building documents full of statistical data and complex models.
Statisticians will appreciate the clean, clutter-free interface and powerful built-in tools that facilitate the creation of structured and professional-looking documents. It also integrates well with pgfplotsand tikzfor producing precise plots and charts. Moreover, TeXmaker includes error highlighting and log file inspection, which is useful when debugging documents that include multiple packages and layers of data visualization.
5. Kile - LaTeX Editor For KDE

Kile: an IDE for LaTeX
Kile is tailored for the KDE desktop environment but works on most Linux distributions. It combines an intuitive interface with powerful LaTeX tools, offering features like command auto-completion, project management, forward/inverse search, and quick access to frequently used commands. Kile is particularly suitable for Linux users working on technical documents that include statistical content.
For data analysts and researchers, Kile supports integration with external compilers and viewers and has strong support for BibTeX, essential for managing references in statistical papers. With its ability to manage multiple documents, define custom tools, and compile large documents quickly, Kile becomes a reliable choice for users creating data-heavy LaTeX reports and theses.
6. Papeeria - Online LaTeX Editor With Collaboration

Introduction to Papeeria System
Papeeria is another online LaTeX editor that prioritizes collaborative editing. It features a simple and modern interface, allowing users to create LaTeX documents from anywhere. Unlike Overleaf, Papeeria focuses on minimalism and speed, providing a distraction-free writing environment for statistical document creation. It also supports version control and team collaboration, which is important for joint research projects and data reporting.
Papeeria offers built-in Git support, enabling seamless tracking of changes in documents involving numerous data points, visualizations, or research findings. It supports various LaTeX packages for statistical plots, and its integration with plotting tools ensures that data visualization is accurate and up-to-date. It’s particularly helpful for students or educators preparing joint papers or presentations based on statistical analysis.
7. Authorea - Collaborative Writing Platform
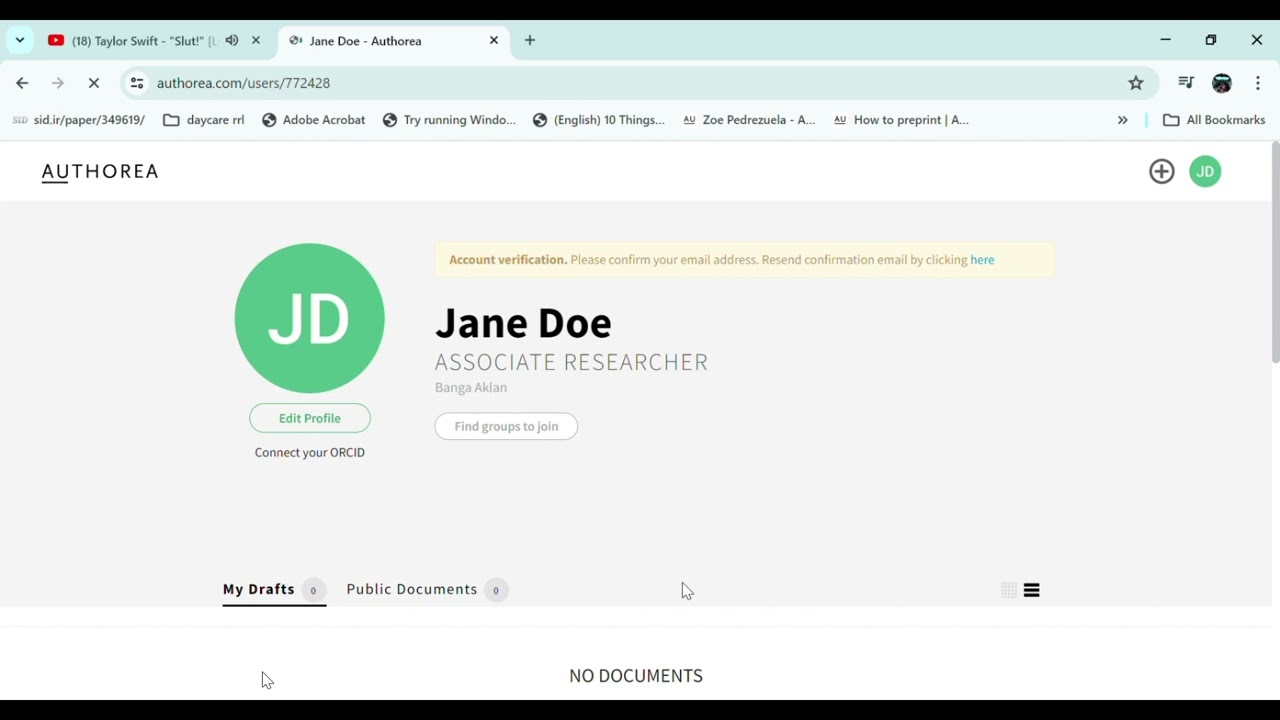
How to download and use Authorea
Authorea is designed for academic and scientific collaboration, allowing users to write LaTeX documents, embed live data, and publish work directly to journals. It supports LaTeX, Markdown, and rich text, catering to diverse user preferences. Its standout feature is the ability to include live code blocks, data, and figures generated by languages like R, Python, or MATLAB within a LaTeX environment.
This makes Authorea particularly useful for statisticians and data scientists who want to keep their documents reproducible and interactive. You can directly link datasets and scripts to your paper, allowing readers or reviewers to see not just the output, but also the underlying methods. Its built-in tools make it easy to manage references, collaborate in real time, and produce highly technical documents without needing to leave the browser.
8. ShareLaTeX - Online LaTeX Editor
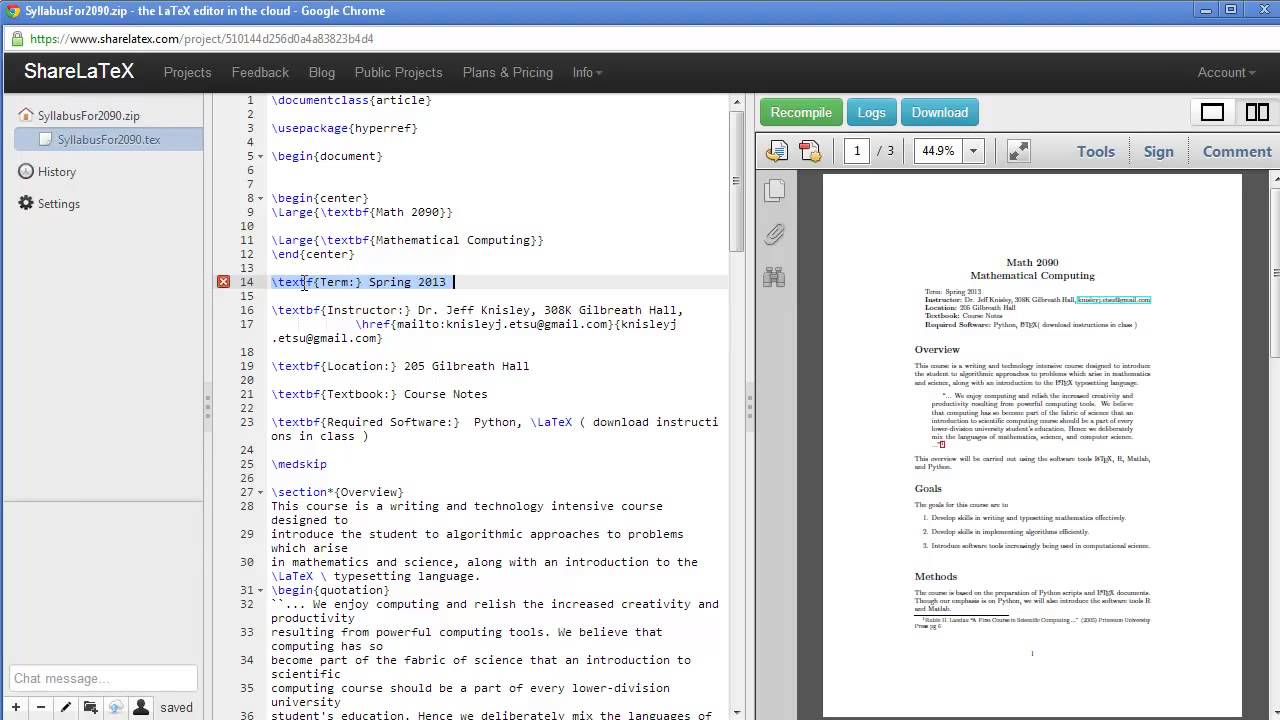
Getting Started with ShareLatex
ShareLaTeX, which merged with Overleaf, was originally an independent LaTeX editor offering cloud-based collaboration. While it now exists as part of Overleaf, it introduced many features that modern LaTeX platforms rely on today. ShareLaTeX was known for its smooth interface, ease of use, and robust project management tools, especially valuable for statistical and academic writing.
Its legacy continues in Overleaf's current interface and toolset. Users working with statistical documents benefit from the version control, GitHub integration, and built-in bibliography management ShareLaTeX helped pioneer. For those who used ShareLaTeX before its merger, the transition to Overleaf has retained all essential features and added even more integrations with statistical tools and platforms.
9. TeXworks - Simple LaTeX Editor

LaTeX on Windows using TeXworks - English
TeXworks is a lightweight, beginner-friendly LaTeX editor that keeps things simple while offering the essential features needed for document creation. It comes with a straightforward interface, real-time PDF preview, and a syntax-highlighting editor. While not packed with advanced features, TeXworks offers everything a student or early-career researcher needs to create clean statistical documents.
Its simplicity does not come at the cost of functionality. TeXworks is compatible with standard LaTeX distributions and supports inclusion of plots and figures through common packages like graphicx, tikz, and pgfplots. For small to medium-sized statistical reports, it is more than capable and is especially appreciated by users looking for speed and low system resource usage.
10. Gummi - Lightweight LaTeX Editor
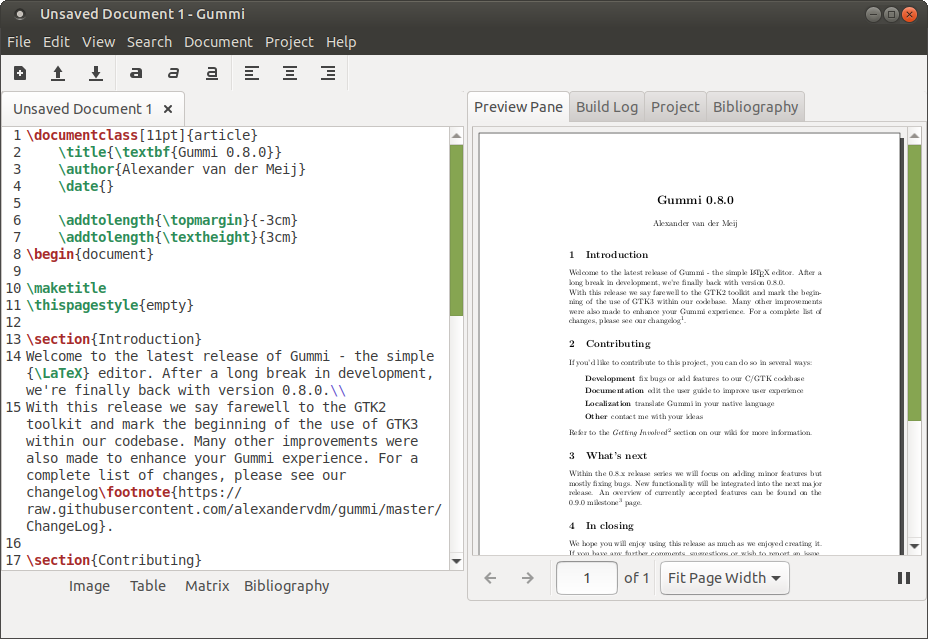
Gummi is another lightweight LaTeX editor for Linux users, designed with simplicity and speed in mind. It offers a live preview window, which is ideal for users who want to immediately see how their equations, tables, or charts appear in the final output. This reduces the back-and-forth between editing and compiling, especially useful when refining statistical visualizations. For those who prefer working directly in a LaTeX editor online, Gummi offers a comparable offline experience with quick rendering.
Though it lacks some of the advanced features of larger editors, Gummi supports the most commonly used LaTeX packages and can handle basic plotting and data presentation through LaTeX's drawing tools. For those working on shorter reports or needing a quick editing tool for statistical content, Gummi provides a distraction-free and efficient solution.
Expert Tips For Effective Data Presentation In LaTeX
1. Use Vector Graphics
When adding graphs or charts to your LaTeX document, use vector images like PDF or TikZ instead of bitmap formats like PNG. Tools like TikZ and pgfplots are built into LaTeX and create clear, scalable visuals. These graphics stay sharp at any size and match the fonts used in your text, making your document look clean and professional.
2. Leverage Specialized Packages
To make advanced charts and graphs, the pgfplots package is one of the best tools available. It can handle mathematical equations, data from tables, and complex visualizations like boxplots and heatmaps. You can even import data from CSV files using the pgfplotstable package. For neat tables with numbers and units, the siunitx package helps format everything consistently.
3. Consistent Styling
Keep your document looking neat by setting up your styles at the beginning (in the preamble). For example, you can make sure the fonts in your graphs match the rest of the document. You can also set consistent font sizes and use clear labels with proper units. Adding captions and legends helps your readers understand the visuals quickly.
4. Color And Clarity
When printing your document, avoid using too many colors. Instead, use patterns or grayscale to keep things readable. If your work will be seen online and color is allowed, choose color schemes that are easy to read for people with color blindness. Also, make sure your font sizes are big enough to be readable when your figures are scaled down.
5. Efficient Workflows
If your document is slow to compile because of large diagrams, try using the TikZ external library. This compiles your images separately and speeds up your work. You can also save time by reusing code. Store frequently used figures in separate files and include them with the \input{}command, or make your custom commands for repeated parts.
You Might Like - How To Use Behavioral Data - A Step By Step Guide
People Also Ask
What Is The Best Way To Integrate R Or Python Data Plots Into LaTeX?
You can export plots from R (using tikzDeviceor ggsaveas PDF) or from Python's matplotlib (with pgfor PDFbackend), then include them in LaTeX using \includegraphics. This keeps your plots vectorized and high quality. If you use knitrin R or Jupyter with nbconvert, you can even create reproducible LaTeX reports with inline code and results.
How Can I Automate Large Reports With Repeated Chart Formats In LaTeX?
Use custom LaTeX commands or environments for repeated chart structures. You can define reusable figure templates in the preamble or separate .texfiles, then \input{}them with different data. This is especially helpful for thesis reports or scientific papers with many similar charts.
What LaTeX Editors Work Best For Data-heavy Documents?
Overleaf is ideal for collaboration and cloud-based compiling. For local editing, TeXstudio and TeXmaker offer robust support for large documents. VS Code with the LaTeX Workshop extension is also a powerful option, especially when combined with Git for version control.
How Can I Make LaTeX Tables Interactive Or Sortable In PDFs?
LaTeX isn’t designed for interactive tables in static PDFs, but you can export LaTeX-style tables as HTML using tools like pandocor knitr. For presentations, consider using the beamerclass and overlay techniques to present tables step-by-step rather than all at once.
Final Thoughts
Picking the best LaTeX app for showing statistical data depends on how you work, your collaboration needs, and how comfortable you are using LaTeX. Some tools are great for real-time teamwork, some focus on powerful graphing, and others make writing easier.
The apps mentioned above offer good choices for researchers, teachers, and anyone dealing with data. Taking the time to learn the right one can help make your reports clearer and more polished.